- Home
- Our District
- Green Initiatives
- Savings Summary Reports
Green Initiatives
Page Navigation
-
November 2021
Energy Savings Progress Summary Report
Year 2 (July 2020-June 2021) *
Facility
% Change Electric
% Change Nat Gas
% Change Total Energy (BTU)
% Change Electric Demand
Avoided Cost
Holland Brook School
-7%
-1%
-3%
-6%
$ 11,455
Readington Middle School
-8%
0%
-4%
-13%
$ 24,460
Three Bridges School
-27%
-3%
-11%
-16%
$ 14,406
Whitehouse School
-17%
6%
-3%
-16%
$ 10,302
Grand Total
-12%
0%
-5%
-11%
$ 60,623
Energy Savings Progress Summary Report
Year 1 (July 2019 - June 2020) *
Facility
% Change Electric
% Change Nat Gas
% Change Total Energy (BTU)
% Change Electric Demand
Avoided Cost
Holland Brook School
6%
-6%
-1%
-1%
$ 8,780
Readington Middle School
-7%
-6%
-6%
-9%
$ 18,200
Three Bridges School
-10%
-18%
-15%
-16%
$ 15,573
Whitehouse School
2%
-5%
-2%
-16%
$ 1,515
Grand Total
-1%
-8%
-6%
-9%
$ 44,068
*Results are compared to 2018-2019 Baseline energy data.
- A negative % change= a reduction in energy use and a positive % change=an increase in energy use.
- The % Change Total Energy column combines the electric and natural gas/inventoried fuel results by converting them to the common reporting unit of British Thermal Units (Btu) for a measurement of total energy change.
- Electric Demand is a measurement of the peak energy usage over the course of a utility billing cycle and is billed as a separate component in most electric bills.
- Avoided Cost is a calculation of energy dollars that would have been spent had energy not been saved. A negative number means an increase in cost.
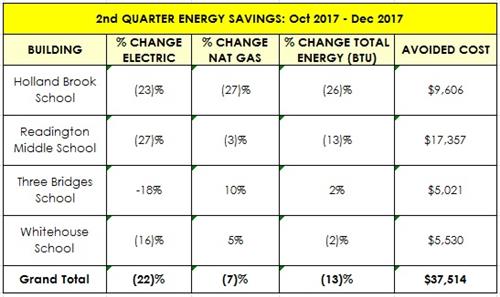
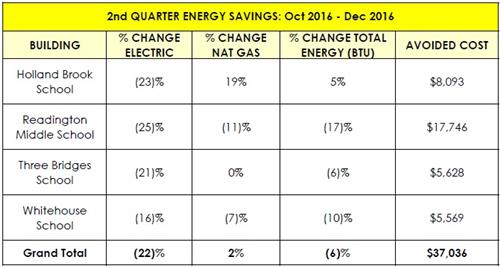
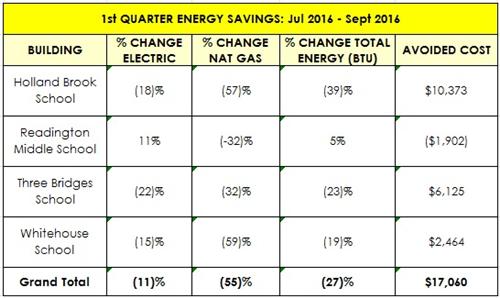
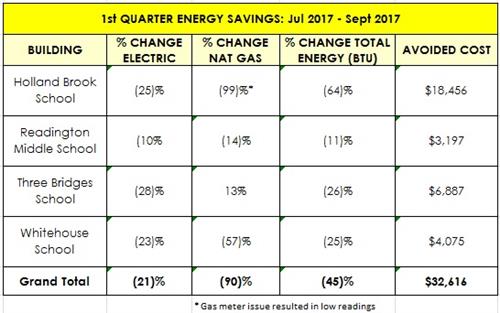 Year 5 District Energy Savings (July 2016 - June 2017):
% Change Electric: -22%
% Change Natural Gas: -16%
% Change Total Energy (BTU): -18%
Total Cost Savings: $131,950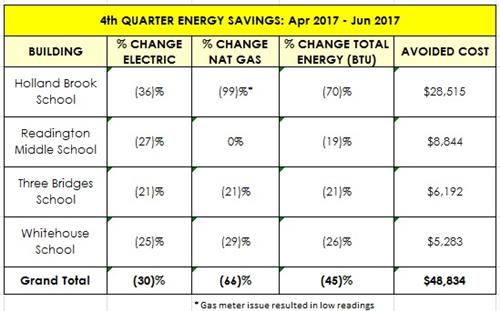
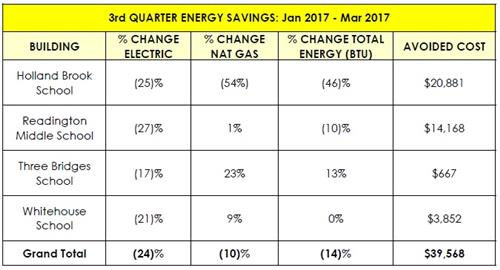
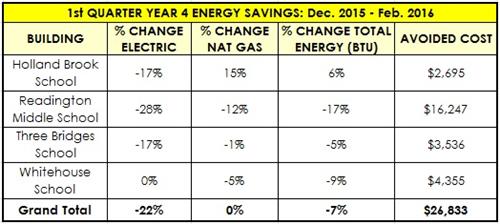
 Year 4 (6 months) District Energy Savings (December 2015 - May 2016):**In June 2016 we transitioned to new energy tracking software and will report energy savings on fiscal year.
% Change Electric: -23%
% Change Natural Gas: -5%
% Change Total Energy (BTU): -11%
Total Cost Savings: $64,338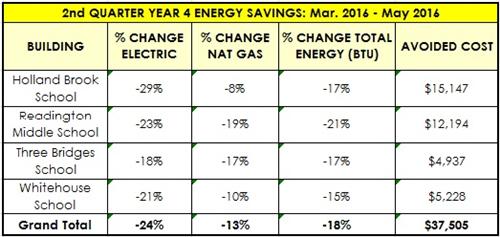
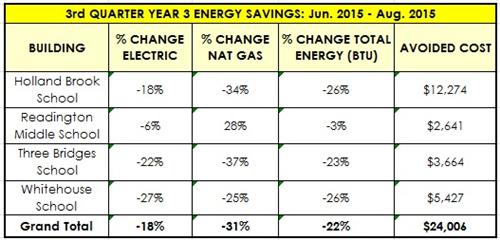
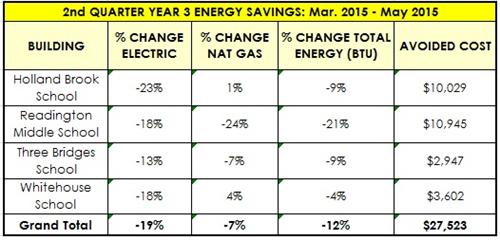
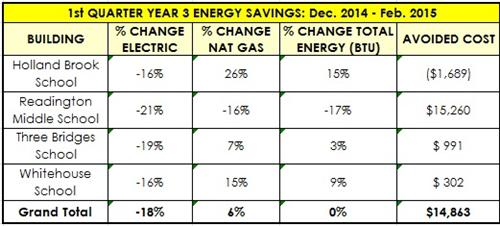
 Year 3 District Energy Savings (December 2014 - November 2015):
% Change Electric: -20%
% Change Natural Gas: -4%
% Change Total Energy (BTU): -10%
Total Cost Savings: $99,050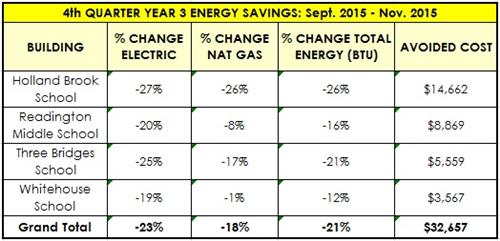
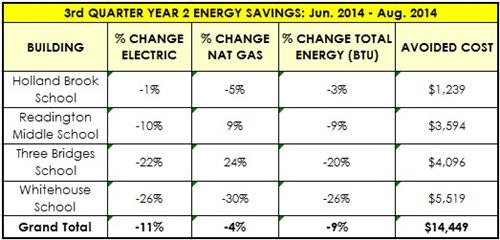
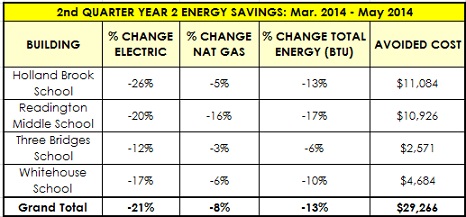
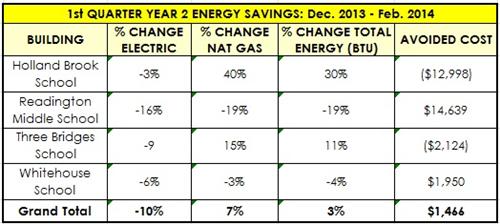
 Year 2 District Energy Savings (December 2013 - November 2014):
% Change Electric: -14%
% Change Natural Gas: 2%
% Change Total Energy (BTU): -4%
Total Cost Savings: $62,763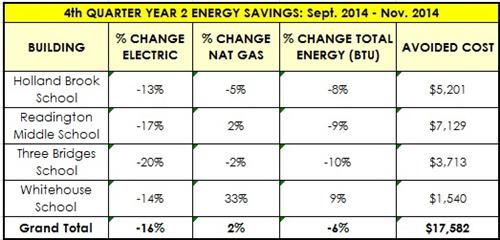
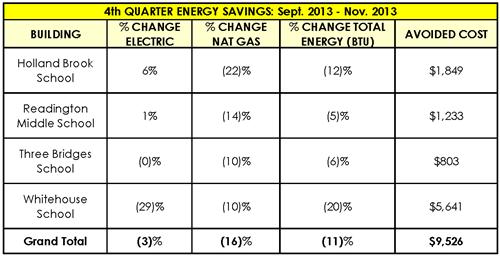
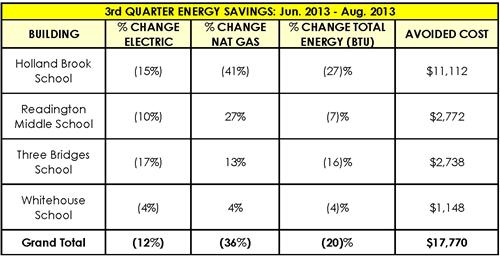
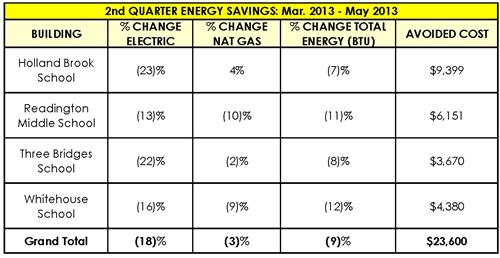
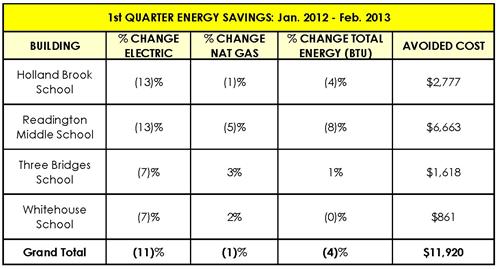
 Year 1 District Energy Savings (December 2012 - November 2013):
% Change Electric: -12%
% Change Natural Gas: -7%
% Change Total Energy (BTU): -9%
Total Cost Savings: $62,815